
B2B Report November 2025
Authors - Magda Nenycz-Thiel & Jenni Romaniuk
A wealth of empirical evidence shows B2B brands grow by expanding the size of their customer base.This means a growing B2B brand attracts many more buyers who buy slightly more often (the famous Double Jeopardy pattern). From this body of research, we get two growth levers: Mental Availability, which is about the brand being easily thought of in buying situations; and Physical Availability, which is about the brand being easy to find and buy.
Summary
A wealth of empirical evidence shows B2B brands grow by expanding the size of their customer base.This means a growing B2B brand attracts many more buyers who buy slightly more often (the famous Double Jeopardy pattern). From this body of research, we get two growth levers: Mental Availability, which is about the brand being easily thought of in buying situations; and Physical Availability, which is about the brand being easy to find and buy.
In B2B, Physical Availability involves improving the brand’s chance of being found and bought. This often involves making (expensive) decisions across channel types such as internal sales staff, third-party distributors, or trade shows, with major repercussions for people’s time and budgets.Therefore, a key aim of this paper is to highlight how to make better Physical Availability investments. These improvements will help you better reap the benefits from building the brand’s Mental Availability.
We also want this report to be a ‘rallying cry’ to get B2B marketers to have input into all areas relevant to brand growth, including areas that are currently often the domain of sales, product design, engineering or IT. Our framework for Physical Availability helps you understand what questions to ask and which decisions matter, with the goal of getting the brand visibly well-placed for buyers to buy.
Background
Prior B2B reports from the Ehrenberg-Bass Institute have covered how:
B2B brands grow by getting more customers, and therefore increasing brand penetration is the key sales KPI;
Your brand’s biggest competitors are (other) big brands, you will typically gain and lose more customers to them than smaller brands;
Brand rejection is low and rarely a barrier to growth.
Mental Availability drives growth, through Category Entry Points.
However, even if all this knowledge is integrated into your marketing efforts, shortcomings in Physical Availability will hamper your ability to get the sale.
It’s Distribution Jim, But Not As We Know It…
A common misconception is that Physical availability is just about building distribution. Yes, distribution is important, but building Physical Availability means working out where and how to efficiently distribute the brand as widely as possible, in an omni-channel world. It also involves maximising the probability the brand can take advantage of wherever it is distributed, by being easy to find and having the right portfolio mix.
Physical Availability covers the following three dimensions:
Presence – be where buying happens (or could happen);
Prominence – be easy to find in sales environments; and
Portfolio – sell a product that effectively and efficiently addresses both current and future
buyer needs.
We now highlight the opportunities/challenges that each area represents and provide questions to help you assess if your brand’s Physical Availability tactics are aligned with evidence-based marketing.
1. Presence: Get Coverage Across Both Buyers And Buying
A ‘presence’ strategy is to determine if the brand is available to be bought. Sales can occur through a sales representative, a brick-and-mortar store, visiting a website or trade show, using an app, or calling a phone number. While it’s easy to say just be present everywhere, all the time, each channel has set up and running costs. A smart brand presence means first covering channels that contribute to as much current revenue and as many current customers as possible, as cost-effectively as you can.
However, we also need to think about the future and the right time to invest in future sales channel opportunities. Enter too early and we risk investing in the wrong channels; but enter too late and the sales landscape becomes crowded and expensive. Therefore, our Presence strategy needs to anticipate the future, but not move too quickly towards it, so we can change course if channel expectations are not met.
In B2B, sales representatives are typically the vanguard of presence. Having direct contact with the customer means sales staff are indeed a valuable source of information on tactical efforts to win business. However, growth in digital transactions limits a sales representative’s view of the category and leads to the risk that Product or Engineering departments will take over the important decisions about digital sales channels. Neither sales reps nor product/engineering teams have a full customer view, therefore decisions about where to sell should be the role of the marketing department, who have visibility across all sales channels.
In a survey of over 500 B2B marketers in the USA and UK, the average number of sales channels they used was between three and four channels (M=3.7). There are obviously many more than four possible sales channels – so how do you know what to add, and what to miss?
To answer that question, we need to cover two key areas: revenue and customers.
Covering Revenue
Covering revenue means establishing presence in line with the channel’s value contribution to category transactions. Compare the revenue of the total category business that comes through each sales channel to the share of your brand’s business that comes through that channel. For example, if 30% of category revenue comes via brand websites, then your brand should have 30% of its revenue via its website. Detecting discrepancies can help identify channels where there is scope for improvement. For example, if 20% of category revenue comes via mobile apps, but only 12% of your brand’s revenue comes via mobile apps, you have scope for improvement.
This information, combined with the category sales dynamics for each channel, helps determine if channel investments need to be higher or lower. For example, if category sales via mobile apps are also growing, it’s even more important to improve performance here.
Covering Customers
Covering customers means assessing presence based on the number of customers that transact in each sales channel. The more people that buy via that channel, the greater your presence should be. If you profile sales channel users, you can detect shortfalls in customer types. For example, you might identify the brand is underperforming in professional services firms, or mid-sized businesses. Understanding which, and how many customers shop across channels in the category helps maximise the number of customers with a chance of buying your brand.
Getting the balance between costs, revenue and customers can be a tricky calculation. This is where LLM models could be employed to identify gaps, over-investments and opportunities, provided you have the appropriate input data.
Establishing Presence
The channels used by more customers and/or getting more revenue are obviously the most attractive, so start with the bigger channels, where you can. This is because typically channels sell to the same type of customers. For example, Table 1 shows that for a B2B software product, most channels sell to the same customer profile.
However, the next best option might be a smaller, specialist channel that gets you incremental sales because you access customers or revenue you would not otherwise reach (e.g., in a specific geographical location or industry sector). Before selecting that smaller, specialist channel, check it lives up to its promises. A common trap is to make unfounded assumptions about channel users (e.g., face-to-face channels are used more by older customers).
We recommend profiling channel users to check any claims about catering to a specialist customer base, and do the calculations to assess the size of the segment reached. For example, Table 1 shows that for a B2B CRM product, the mobile app is used by more female category buyers than the website (33% versus 26%). However, visiting the website is 2.5x1 more common than using a mobile app and so is used by more women in total. This means if you aim to improve Physical Availability for female category buyers, boosting access to the website is a better avenue.
Table 1: Demographic And Firmographic Profile Of Channel Users For A B2B CRM Software*
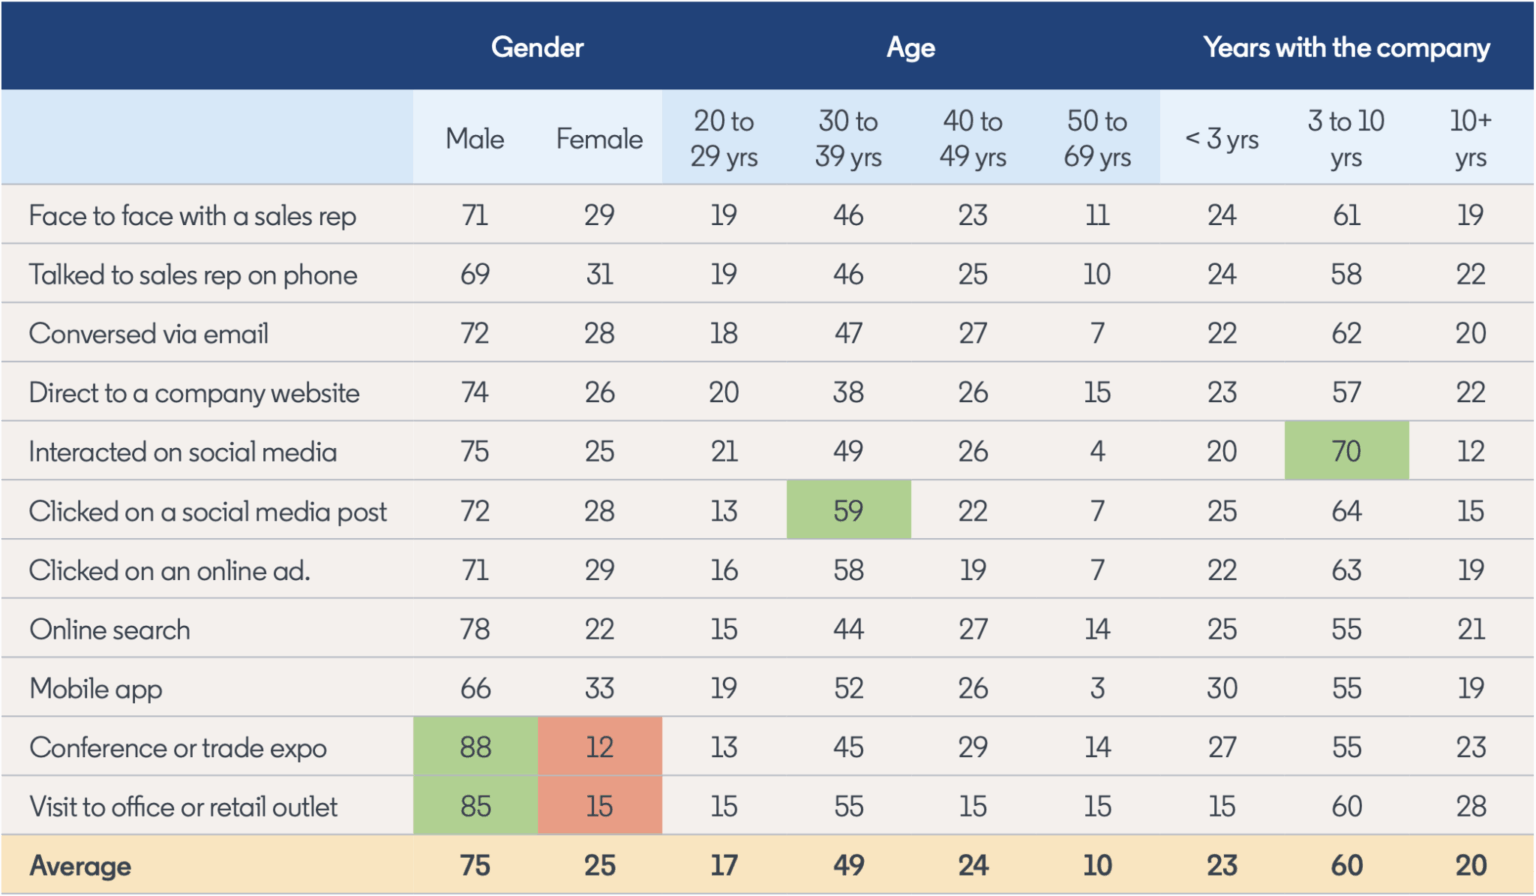
 Source: Ehrenberg-Bass Institute Survey conducted for Linkedin(USAn=415)
*deviations +/-10pp from average highlighted
Understanding channel interaction
We’d like to be present everywhere, all the time, but budget constraints mean 100% coverage is rarely possible. By drawing on the Duplication of Channel Shopping law, we can benchmark expected channel sharing levels. This variation on the well-known Duplication of Purchase law, says that channels share buyers in line with the other channels’ penetration. Knowing how customers buy across channels helps you identify:
(a) Expansion opportunities – identify smaller channels that get the brand incremental sales by reaching additional buyers; and
(b) Rationalisation opportunities – identify channels with higher overlap, such that removing one option frees up resources to be more efficiently deployed elsewhere.
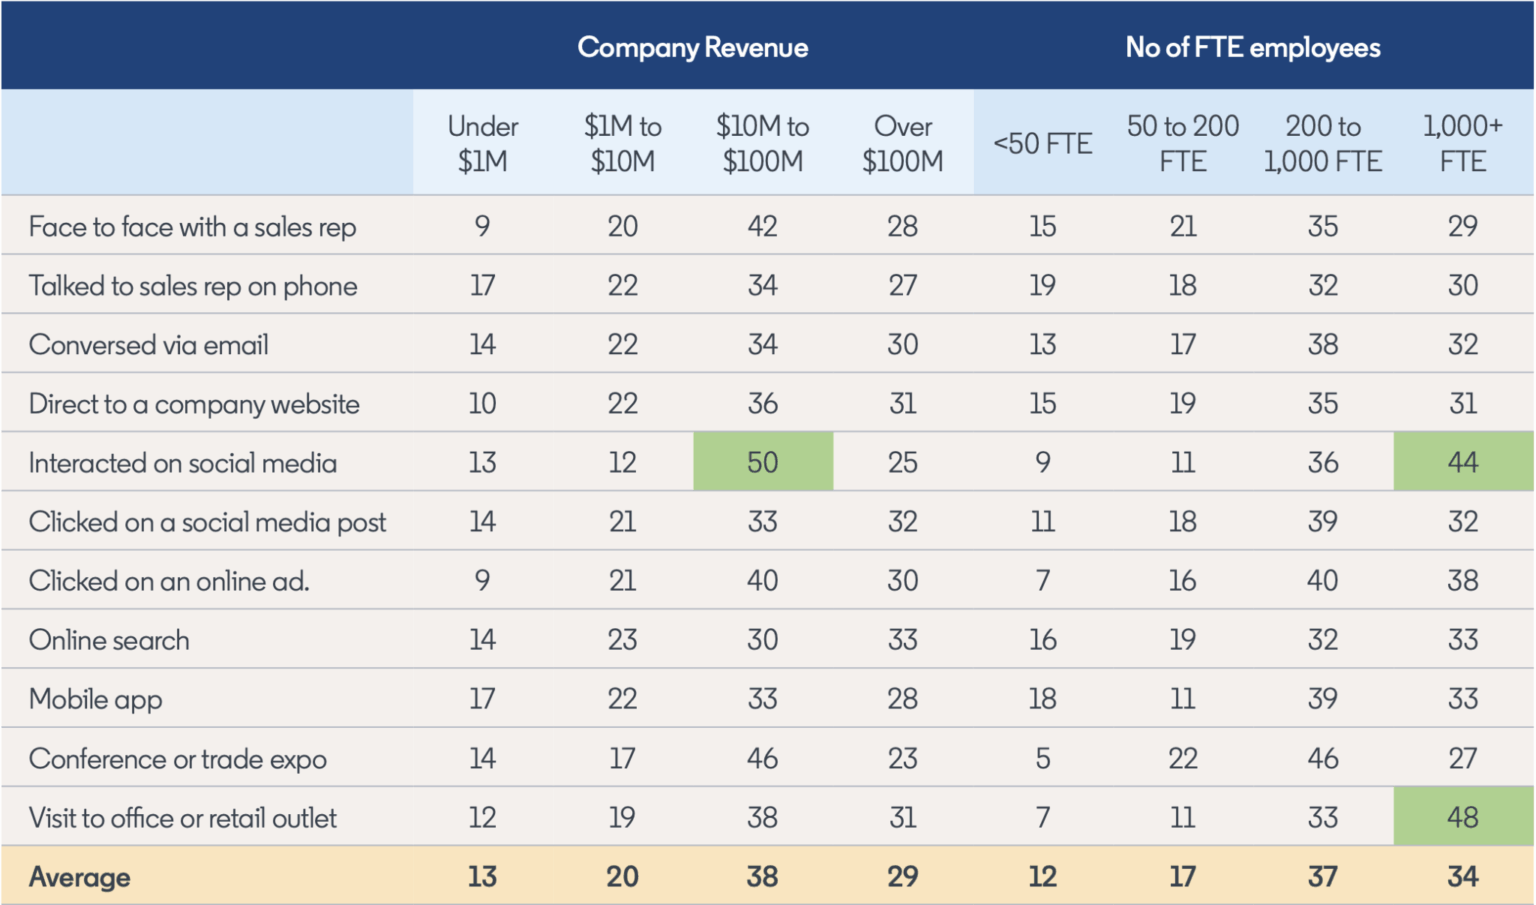
Table 2 is an example from another B2B software category, where over 400 B2B category buyers were asked about channels bought through over the last three years. As highlighted in yellow, the average sharing between sales channels declines with channel penetration, as predicted by the Duplication of Channel Shopping law.
While customers don’t use channels exclusively, they interact across channels predictably. For example, more customers who use any sales channel also engage with a sales rep on the phone than interact via mobile app or visit an office/retail outlet.
We can also see rationalisation opportunities: Social media post & online ads (highlighted in blue); Social media post & Mobile app (highlighted in green); and Conference/trade expo & Visit to office/retail outlet (highlighted in orange). These channel pairs have higher customer overlap than they should (based on the benchmark). Therefore, if your brand is sold in one channel option of the two, the other is less necessary.
We can also see an expansion opportunity. Customers that have engaged face to face with a sales rep are less likely to engage with most general online channels such as search, online advertising, social media posts or mobile apps (shaded in red). These online and mobile options are natural complements to a sales team and are attractive for customers that don’t want or need personal contact. This helps design a mix where channels work together to fill in each other’s weaknesses and avoid wasting resources.
Each category has its own peculiarities. Therefore, we recommend you undertake this analysis for your category’s channels to identify opportunities for rationalisation or expansion.
Table 2: Sharing Of Customers Across Sales Channels For A B2B Financial Services Product (n=624)*
 Source: Ehrenberg-Bass Institute Survey conducted for Linkedin(USAn=415)
*deviations +/-10pp from average highlighted
Presence Check Up Questions
Can you expand your presence in currently popular sales channels (customers or revenue) to get a greater share of existing sales?
Are any sales channels rapidly growing in customer or revenue contribution where increased investment will pay off in future sales?
Are there sales channels that could expand your brand’s potential customer base, by improving access to customers or sales you don’t currently reach?
Aim to set the brand up for the near future, without getting too far ahead of customer buying behaviour. It takes a long time for customers to give up using existing channels, so don’t abandon or withdraw investment from ‘legacy’ channels too quickly. Instead, experiment and learn about new channels for tomorrow while taking care of where the customers buy today. Some areas to think about for the future:
How will AI assisted search, where the answer is present in the summary rather than needing to click on a blue link, affect your website traffic? Do you have content that will enable your company to show up but still encourage people to seek you out more information?
What will be the role of AI agents in the future for your products’ sales? There are some categories where adoption might be quite quick and being ahead of the curve is of value, while others are likely to take longer and so it is better to wait a bit and see how the technology develops – where do the products you sell sit?
2 . Prominence: Standing Out In A Sea Of Clutter
You can pick your child easily out of a crowd of children. But if I ask you to find my child it would be more challenging for you. I can give you a description, but this only works if that visual description includes elements distinctive to my child. For example, knowing she has two eyes is less helpful than knowing her top has purple butterflies.
Similarly, it is easy to spot the brands we work with in a crowded marketplace, but what about anyone else? Have we dressed up our brand to look distinctive, and given the customer the tools to find it?
You are probably thinking – we have a great logo – what more do we need? Well, the logo may look good but can it do the work? Does it enable the brand to stand out in any (let alone all) sales environments? And if not, do you have other visual elements that help a (potential) customer find the brand when the logo might not cut through?
Prominence is making a brand/company easy to find in all sales environments, bricks-and-mortar, digital or mobile. If you are selling on a marketplace website, how easily does your brand attract the viewer’s eye? On an average smart phone with 80 or so apps, how eye catching is your app? The more sales channels a brand uses, the more diverse the environments where a brand/company must stand out. You can own or rent prominence:
Rented prominence – This is when you pay for better real estate within a sales environment. For example, to be on the first online page, paid search, conference sponsorship, or front of store placement to improve brand visibility in retail settings. This is a temporary sugar hit to your brands’ sales. You only get the benefit when you pay for it. If you stop paying for it, a competitor can take your place.
Owned prominence – These are the Distinctive Assets that work as branding devices in sales environments. When managed well, Distinctive Assets are with the brand for the long term. These branding devices don’t grow overnight, you need to teach customers how to find your brand.
Reliance on rented prominence puts you at the mercy of the landlord. However, while every B2B brand has a logo, there is often not much else to boost branding effects. This means B2B brands are often ill-equipped to cut through environmental, mental, or competitive clutter.
Different asset types give you more options to help the brand stand out in any environment. Here are some examples from B2B brands, can you identify the brand behind the Distinctive Asset (answers at the end of the paper).
Prominence Challenge: Which brands do these assets belong to?
Find the answers at the end of the paper.

Reliance on rented prominence puts you at the mercy of the landlord. However, while every B2B brand has a logo, there is often not much else to boost branding effects. This means B2B brands are often ill-equipped to cut through environmental, mental, or competitive clutter.
Different asset types give you more options to help the brand stand out in any environment. Here are some examples from B2B brands, can you identify the brand behind the Distinctive Asset (answers at the end of the paper).
A diverse set of assets might include a visual image, word-based asset, colour combination, a face and maybe an audio asset if audio media are commonly used.
For long term brand identity building, assess the environments where you are more vulnerable and create a plan to build a Distinctive Asset to help there. Where you do use ‘rented prominence’ try to employ a ‘rent to buy’ tactic instead. Rented prominence works better when it leverages Distinctive Assets, so both can work together until you have enough branding strength to stop needing that expensive sugar-hit.
Prominence Check Up Questions
What obstacles prevent potential buyers from finding your brand in sales channels?
Do you have a diverse set of Distinctive Assets?
Do you have a plan to wean your brand off the sugar hit of ‘renting prominence’?
3. Portfolio: Have Enough Options, But Not Too Many
The science (and art) of portfolio management is like channel management, where it is necessary to cover current needs, while also planning for future needs. Two complementary ways to identify the parts of the category you want to cover (a) sales data and (b) Category Entry Points (CEPs). Sales data will tell you which product types within the category currently sell the most, which are growing or declining, and the sales competitive intensity. CEPs help you to understand how each of your products match the buyer mindset as they enter ‘buying mode’, and the level of mental competitive intensity.
Combining sales and memory metrics helps suggest useful portfolio investments. This needs to be matched with company capabilities. For example, an AI enhanced offering might be desired by customers for a category, but unless your company has the credibility and capability to offer this, it will be a difficult area for your brand to cover.
Learn more about how to execute a CEP-led strategy in B2B here.
Good portfolio management is knowing, protecting, and investing in the core product/service, the one that contributes the most to the brand/company’s top and bottom line. Protecting the core is about protecting current and future revenue. It is important to ensure any marketing decision ‘does no harm’ to what is currently the most important company revenue source. It’s difficult to access this information widely across B2B companies, but a benchmark from packaged goods, where data is more easily available, is that the top-selling product contributes 44% to total brand revenue (Tanusondjaja et al, 2018).
When we asked B2B marketers to estimate the contribution of the core product/service to their brands’ revenue, around 30% could not give any answer. Of those that could answer, the average sales contribution is 50% (see Figure 1), slightly higher for those with five or fewer products (63%).
This suggests there are brand portfolios with long tails full of low sales generating products, as if the core product contributes 52% for a company with over 20 products, the remaining 19+ products are responsible for the remaining 48% of sales. If you can slim down your portfolio and get rid of underperforming products it can free up funds to invest in more scalable or valuable areas. Then with an in-shape portfolio you can look to smart areas to innovate and develop new products/services.
Figure 1: Average Sales Contribution Of Core Product


Portfolio Check Up Questions
Do we have products/services to cover the major parts of the market?
Are we seeding and not bleeding the core to keep it generating revenue?
Do we have products/services in growing parts of the category?
Do we have a plan to remove the deadweight in the portfolio, reallocate resources to more promising options, and boost overall profitability?
In the future LLM’s could aid B2B marketers portfolio decisions, by going beyond analysing sales patterns to exploring unstructured data like feedback from sales reps or customer emails for patterns linked to successful sales and future customer needs.
Wrap up
Remember it’s Mental and Physical availability, not Mental or Physical Availability. Physical Availability helps a brand to realise the advantages gained from Mental Availability building activities. Hopefully in the future they will have Cannes awards for performance in Physical Availability, but until then we will just have to settle for more profitable sales.
There is still much to learn in the B2B space, so stay tuned for more developments as we continue our R&D.
And in the meantime, check out the answers to the prominence challenge below.
Prominence Challenge Answer Key

Supporting References
Goodhardt, G. J. and A. S. C. Ehrenberg (1969). “Duplication of television viewing between and within channels.” Journal of Marketing Research 6(2): 169-178.
Nenycz-Thiel, M. and J. Romaniuk (2022). Building Physical Availability: Prominence and Portfolio. How Brands Grow: Part 2. J. Butler. Victoria, Australia, Oxford University Press: 159-172.
Nenycz-Thiel, M. and J. Romaniuk (2023). What about Physical Availability? Better Brand Health. J. Butler. Victoria, Australia, Oxford University Press.
Nenycz-Thiel, M., J. Romaniuk and B. Sharp (2022). Building Physical Availability: Presence. How Brands Grow: Part 2. J. Butler. Victoria, Australia, Oxford University Press: 140-158.
Romaniuk, J. (2018). Building Distinctive Brand Assets. South Melbourne, Victoria, Oxford University Press.
Romaniuk, J. (2022). Category Entry Points In A B2B World: Linking Buying Situations To Brand Sales. Sunnyvale, CA, Ehrenberg-Bass Institute for Marketing Science: 1-33.
Romaniuk, J., B. Sharp, J. Dawes and S. Faghidno (2021). How B2B Brands Grow. Sunnyvale, CA, Ehrenberg-Bass Institute for Marketing Science: 1-62.
Tanusondjaja, A., M. Nenycz-Thiel, J. Dawes and R. Kennedy (2018). “Portfolios: Patterns in brand penetration, market share, and hero product variants.” Journal of Retailing and Consumer Services 41: 211-217.